
June Market Report Shows Strong Showing Activity
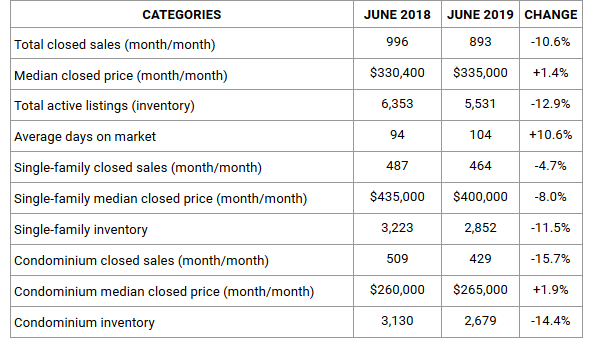
Naples, Fla. (July 19, 2019) – Naples was recently voted the number one southern “boomtown”, which might be one reason showings were up during June. The June 2019 Market Report released by the Naples Area Board of REALTORS® (NABOR®), which tracks home listings and sales within Collier County (excluding Marco Island), revealed that 500 potential buyers were shown homes for sale in the Naples area every day during June. Closed sales in the Naples area during June decreased 10.3 percent compared to closed sales in June 2018, but closed sales since January have only decreased .7 percent. In fact, closed sales over the last 12 months are up in all price categories below $1 million.
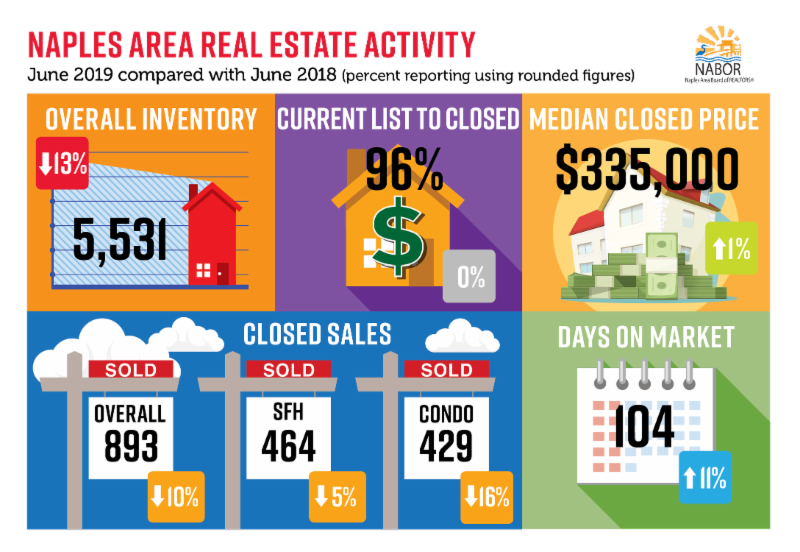
“Now is the time to enter the market,” said Mike Hughes, Vice President and General Manager of Downing-Frye Realty, Inc., who added that only homes in the $1 million to $2 million had a median closed price decrease in June. “Even though inventory in June dropped almost 12 percent, values are holding steady and the reduced competition provides great opportunities for sellers.”
Bill Coffey, Broker Manager of Amerivest Realty Naples, added that despite the inventory decrease “there is still 6.9 months of inventory available, which is well above the Florida average of 4-months supply.” Broker analysts reviewing the June 2019 Market Report recommend sellers consult a REALTOR® before listing a home for sale. A REALTOR® can help a seller price a home competitively. They can also maximize the home’s marketing and help the seller or buyer every step of the way.
A shift in buyer interest to single family homes in lower price categories during the second quarter of the year was confirmed by broker analysts. During June, new listings for single family homes decreased 7.1 percent, while new listings for condominiums decreased 4.2 percent.
According to the report, there were 798 price decreases in June. Yet the month’s overall median closed price increased 1.4 percent to $335,000 from $330,400 in June 2018. The single-family home median closed price decreased 8 percent in June, while the condominium market median closed price increased 1.9 percent.
The NABOR® June 2019 Market Reports provide comparisons of single-family home and condominium sales (via the Southwest Florida MLS), price ranges, and geographic segmentation and includes an overall market summary. NABOR® sales statistics are presented in chart format, including these overall (single-family and condominium) findings:
“Year over year only properties above $2 million have had price increases,” said Kathy Zorn, broker/owner, Better Homes and Gardens Real Estate Pristine. “In fact, the report shows condominiums under $300,000 have experienced a year over year decrease of 7.6 percent.”
According to Wes Kunkle, President and Managing Broker at Kunkle International Realty, “the commercial market in Naples is seeing some new investor activity but not nearly as much as what Lee County is experiencing.”
“Loan modifications coming due for some homeowners could be one reason there is an increase in foreclosures recently,” said Lauren Melo, Broker at Florida’s Realty Specialists. “But the number of HELOCs are also on the rise, which could also indicate increased equity and an improving market.”
If you are looking to buy or sell a home in Naples, contact a Naples REALTOR® who has the experience and knowledge to provide an accurate market comparison or negotiate a sale. A REALTOR® can ensure your next purchase or sale in the Naples area is a success.
CLICK HERE: https://files.constantcontact.com/85a2c058001/47eb81b5-7528-46d9-98ee-8c5515098f2f.pdf to view ALL 21 Naples Market Report Charts!
21 Extremely Informative charts providing user-friendly statistics on the following individual categories…
- Overall Market
- Single Family Homes
- Condos
- Closed Sales
- Closed Sales by Price Range
- Median Closed Price
- Median Closed by Price Range
- Percent of List Price Received
- Percent of List Price Received by Price Range
- Days on Market
- Days on Market by Price Range
- New Listings by Month
- Inventory
- Inventory by Price Range
- Listings & Sales by Area (Naples, Central Naples, East Naples, Immokalee, Naples Beach, North Naples, South Naples)
- Naples Beach Report 34102, 34103, 34108
- North Naples Report 34109, 34110, 34119
- Central Naples Report 34104, 34105, 34116
- South Naples Report 34112, 34113
- East Naples Report 34114, 34117, 34120, 34137
- Immokalee/ Ave Maria Report
CLICK HERE: https://files.constantcontact.com/85a2c058001/47eb81b5-7528-46d9-98ee-8c5515098f2f.pdf to view ALL 21 Naples Market Report Charts!