
August Home Sales Strong as Prices Hold Steady
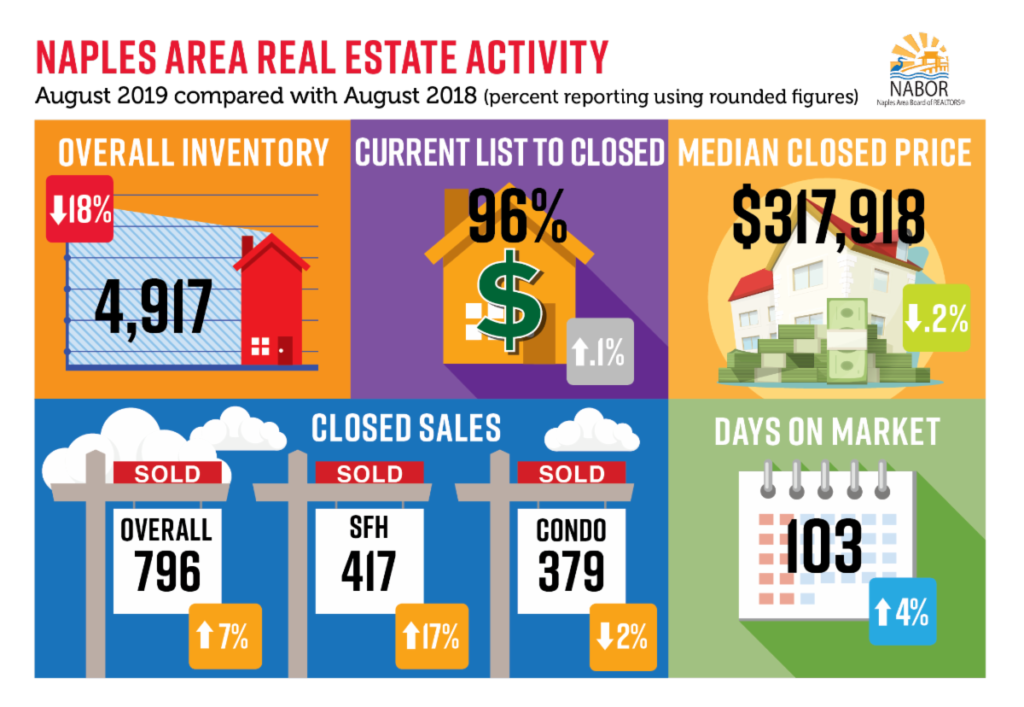
Naples, Fla. (September 20, 2019) – Closed sales of homes in Collier County increased 7.4 percent in August, but overall inventory fell 17.8 percent to 4,917 properties compared to 5,980 in August 2018, according to the August 2019 Market Report released by the Naples Area Board of REALTORS® (NABOR®), which tracks home listings and sales within Collier County (excluding Marco Island). This reduction in inventory – which included 616 homes that were either terminated, expired or withdrawn from the Southwest Florida MLS in August – resulted in a six-month supply of inventory for Collier County at the end of August.
“We know that traditionally, inventory will begin to creep up in September, October and November as many sellers try to get a jump on the competition that might list their properties closer to our winter season,” said Mike Hughes, Vice President and General Manager for Downing-Frye Realty, Inc. “But the pre-season months (September through November) can be a great time for buyers as well. Buyers will find less competition [from other buyers] in the pre-season months. They will also get an early peek at properties that will probably sell during season.”
The August ShowingTime report indicated that local REALTORS® scheduled 16,878 appointments during August. This is an increase of 16 percent compared to showings in August 2018. On average, a home in the Naples area is shown 16 times before it secures a contract. Broker analysts reviewing the August Report are leery of sales activity next year as sellers will face market uncertainty brought on by a presidential election. In the third quarter of 2016 – right before the last presidential election – overall closed sales in Collier County decreased 14 percent compared to closed sales during the third quarter of 2015.
Budge Huskey, President of Premier Sotheby’s International Realty added, “The overall market is very healthy today based on the average person’s financial position continuing to improve in tandem with the economy. Yet in the luxury and upscale second homes markets, which are often elective, buyers tend to have a longer-term horizon and base investment decisions on where they believe the economy and markets will be a year or more out in the future. Accordingly, there are mixed signals and sentiment.” Incidentally, the $300,000 to $500,000 price category led closed sales in August with a 10.1 percent increase followed by closed sales of properties under $300,000, which increased 6.5 percent. Closed sales of homes between $1,000,000 and $2,000,000 decreased 5.7 percent. “Sales of single-family homes were up almost 10 percent this August,” said Huskey. “Despite the reduced inventory overall, new listings coming on the market were up 4 percent in August and builder inventory is up as well.”
The median closed price in August decreased just 0.2 percent to $317,918, which is only $582 lower than the median closed price in August 2018 ($318,500). In fact, price increases have only been reported in two of the last 12 months (October 2018, 3.7%; and April 2019, 3.4%). “We don’t know how changes in the political climate will affect the housing market in 2020,” said Wes Kunkle, President and Managing Broker at Kunkle International Realty. The August Report showed median closed prices for homes below $300,000 and homes between $1 million and $2 million decreased 4 percent in August, while homes between $300,000 and $1 million showed no change in median closed prices.
The NABOR® August 2019 Market Reports provide comparisons of single-family home and condominium sales (via the Southwest Florida MLS), price ranges, and geographic segmentation and includes an overall market summary. NABOR® sales statistics are presented in chart format, including these overall (single-family and condominium) findings:
| CATEGORIES | AUG 2018 | AUG 2019 | CHANGE |
|
Total closed sales (month/month) | 741 | 796 | +7.4% |
|
Median closed price (month/month) | $318,500 | $317,918 | -0.2% |
|
Total active listings (inventory) | 5,980 | 4,917 | -17.8% |
|
Average days on market | 99 | 103 | +4.0% |
|
Single-family closed sales (month/month) | 356 | 417 | +17.1% |
|
Single-family median closed price (month/month) | $405,000 | $399,000 | -1.5% |
|
Single-family inventory | 3,147 | 2,523 | -19.8% |
| Condominium closed sales (month/month) | 385 | 379 | -1.6% |
|
Condominium median closed price (month/month) | $250,000 | $245,000 | -2.0% |
|
Condominium inventory | 2,833 | 2,394 | -15.5% |
Kunkle added, “We have an entire generation of first-time homebuyers who have never seen interest rates over 6 percent. With the recent quarter percentage point cut in interest rates, there isn’t been a better time to lock in and buy than now!” Geographically, closed sales of single-family homes in the East Naples are (34114, 34117, 34120, 34137) increased the most in August by 35.6 percent followed by closed sales of single-family homes in North Naples (34109, 34110, 34119), which increased 15.6 percent.
Jeff Jones, NABOR® President and Broker at Keller Williams Naples, added, “There were 1,443 price reductions made during August [29 percent of the total homes listed], which is important for buyers as this is an indication that many sellers are eager to sell!”
If you are looking to buy or sell a home in Naples, contact a Naples REALTOR® who has the experience and knowledge to provide an accurate market comparison or negotiate a sale. A REALTOR® can ensure your next purchase or sale in the Naples area is a success.
CLICK HERE: https://files.constantcontact.com/85a2c058001/ccf437fc-3be7-4eda-a2da-2814bf2bada4.pdf to view ALL 21 Naples Market Report Charts!
21 Extremely Informative charts providing user-friendly statistics on the following individual categories…
- Overall Market
- Single Family Homes
- Condos
- Closed Sales
- Closed Sales by Price Range
- Median Closed Price
- Median Closed by Price Range
- Percent of List Price Received
- Percent of List Price Received by Price Range
- Days on Market
- Days on Market by Price Range
- New Listings by Month
- Inventory
- Inventory by Price Range
- Listings & Sales by Area (Naples, Central Naples, East Naples, Immokalee, Naples Beach, North Naples, South Naples)
- Naples Beach Report 34102, 34103, 34108
- North Naples Report 34109, 34110, 34119
- Central Naples Report 34104, 34105, 34116
- South Naples Report 34112, 34113
- East Naples Report 34114, 34117, 34120, 34137
- Immokalee/ Ave Maria Report
CLICK HERE: https://files.constantcontact.com/85a2c058001/ccf437fc-3be7-4eda-a2da-2814bf2bada4.pdf to view ALL 21 Naples Market Report Charts!