
Realistic Home Values Led to Strong Sales in March
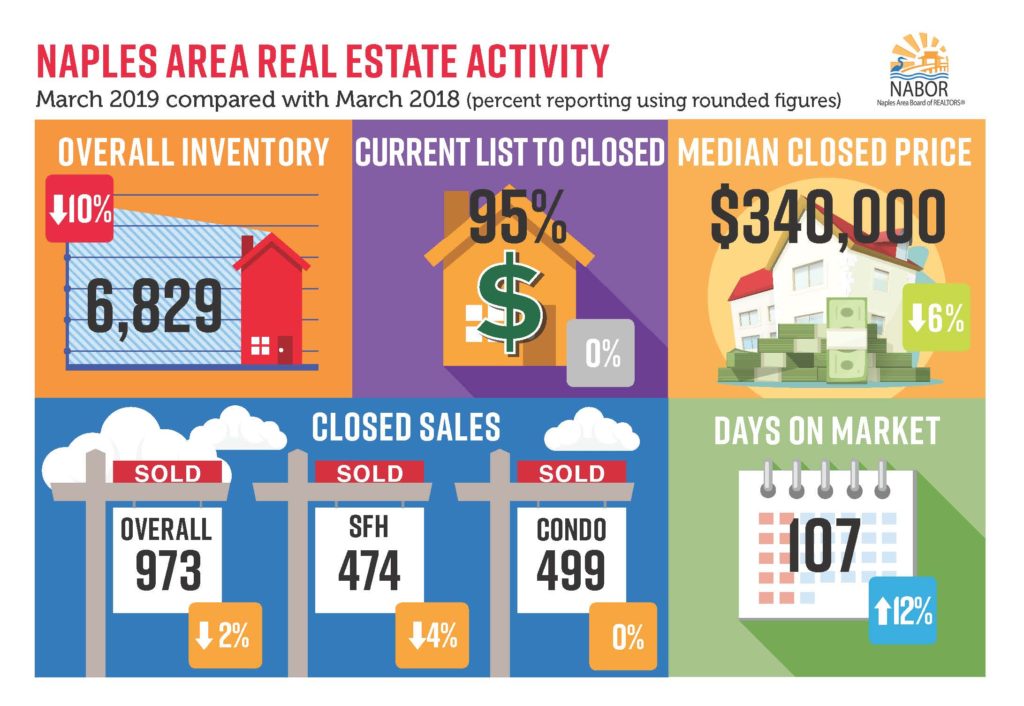
APRIL 18th 2019: According to the March 2019 Market Report released by the Naples Area Board of REALTORS® (NABOR®), which tracks home listings and sales within Collier County (excluding Marco Island), the median closed price of homes decreased 5.6 percent to $340,000 in March 2019 from $360,000 in March 2018. Broker analysts reviewing the report clarified that the median closed price decrease was due, in part, to an increase in the number of closed sales of homes priced under $500,000 during the last year.
Another reason for the decrease in median home price is due to sellers pricing their homes appropriately – based on actual comparisons of recently sold homes – to gauge their home’s estimated value rather than pricing their homes based on unvalidated values.
The March 2019 Market Report showed overall closed sales decreased 1.7 percent to 973 in March 2019 compared to 990 in March 2018. This decrease was isolated to the single-family home market, whose sales in March 2019 fell by just 17 total sales compared to March 2018. The condominium market in March ended with 499 closed sales, the same number reported in March 2018. However, the report also showed closed sales in March increased 64 percent compared to February 2019, which reported 595 closed sales; and it increased 65 percent compared to January 2019, which reported 588 closed sales.
Many brokers have reported an increase in contracts (pending sales) during March, which they feel contributed to the 10 percent decrease in overall inventory for March. Inventory during the first quarter of 2018 included many homes that were put back on the market after having been taken off the market for repairs following Hurricane Irma during the last quarter of 2017. As such, the report showed 8.7 months of inventory for March 2019, down 11 percent compared to March 2018.
CLICK HERE: https://www.nabor.com/clientuploads/Market%20Statistics/March%202019%20Stats/March_Naples_Area_Market_Stats.pdf to view the ALL NEW Naples Market Report Charts!
21 Extremely Informative charts providing user-friendly statistics on the following individual statistics…
- Overall Market
- Single Family Homes
- Condos
- Closed Sales
- Closed Sales by Price Range
- Median Closed Price
- Median Closed by Price Range
- Percent of List Price Received
- Percent of List Price Received by Price Range
- Days on Market
- Days on Market by Price Range
- New Listings by Month
- Inventory
- Inventory by Price Range
- Listings & Sales by Area (Naples, Central Naples, East Naples, Immokalee, Naples Beach, North Naples, South Naples)
- Naples Beach Report 34102, 34103, 34108
- North Naples Report 34109, 34110, 34119
- Central Naples Report 34104, 34105, 34116
- South Naples Report 34112, 34113
- East Naples Report 34114, 34117, 34120, 34137
- Immokalee/ Ave Maria Report